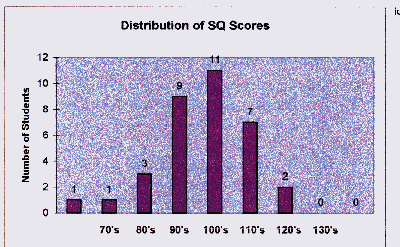
Calculating Social Quotients

1. SQ is a quotient, like the original IQ.
The calculation is different, but the results are very similar. Both form a bell shaped curve, as in the SQ chart for a typical class at left. For both IQ and SQ, the average score is 100, and half of all scores often fall between 90 and 110. Because IQ and SQ measure very different abilities, those who score well in one do not necessarily do well in the other. Both skills are important in career success.NOTE: The links suggested in thin blue below are full-page charts and may take extra time to come to your screen.
2. Each classmate's A to E mark of a person
(see side A of the SQ survey form) is translated into a number, with a neutral "C" = 100. A person's marks are added, then their sum is divided by the number of marks, to get a Social Quotient. For example, a new person not well known could get 25 C's = 2500, divided by 25 classmates = 100 SQ. (See the pale blue areas of a person's SQ printout.)3.
Identifying useful popularity traits is done by comparing SQ to marks on side B of the SQ survey form. Side B contains the same items as on the Popularity Test (m) you may have already taken. A computer compares the low to high answers on that test (for items like happiness or height) to that individual's SQ score. The comparison reveals which traits people most seek out in others, based on the question asked. The items on the Popularity Test (f) are listed in their order of importance, using results of SQ surveys done to date.Go to:
Using SQ results to get a good jobGo to:
How to participate in an SQ SurveyGo to:
Home Page
The ads below are placed by Google.com - they are not necessarily endorsed by this site