Average IQ of Countries
The average IQ in the United States is
usually set at 100. Groups within the US score different average IQ's, such as 115 for college grads or 85 for African-Americans. Similarly, average IQ varies from country to country, shown in the 2002 book IQ and the Wealth of Nations (sets Britain at 100):For a 2010 update of IQ's 113 nations of go to: http://sq.4mg.com/NationIQ1.htm
From Intelligence and the Wealth and Poverty of Nations by Richard Lynn and Tatu Vanhanen
Markings next to a rank means this area was a world leadiing civilization
*=once **=twice ^=near leading See: http://sq.4mg.com/AppA.htm
The top 5 nations above were also the top scorers (different order) in 8th grade math and science in 2003. The US ranked 15th in math and 9th in science. Details at http://timss.bc.edu/timss2003.html
See also how major nations' 15 year old school children scored in Math, Science, and Reading in PISA 2006 testing
Click for list of
Click for: - possible
causes of IQ differences among nations- a
summary of what IQ is and how it is calculatedThe book's authors Lynn (psychology, U. of Ulster) and Vanhanen (political science, U. of Helsinki) analyzed 168 national IQ studies. They argue that a significant part of the gap between rich and poor countries is due to differences in national intelligence. There is a similar pattern within the United States, where higher IQ states have higher incomes. On Lynn's website you can see:
the IQ data sources used for 60 countries (at http://www.rlynn.co.uk/pages/article_intelligence/7-a1.asp)
and IQs for 185 countries
- some "Based on the IQs of Neighbouring or Other Comparable Countries" (at http://www rlynn.co.uk/pages/article_intelligence/t4.asp).Comments by a reviewer:
"This brilliantly conceived, superbly-written, path-breaking book, does for the global study of economic prosperity what Herrnstein and Murray's (1994) The Bell Curve did for the USA. IQ and the Wealth of Nations examines IQ scores and economic indicators in 185 nations. It shows that national differences in wealth are explained first, by the intelligence levels of the populations; second, by whether the countries have market or communist economies; and finally, by unique circumstances such as, in the case of Qatar, by sitting atop a sea of oil."(The information above is partly based on http://btobsearch.barnesandnoble.com/booksearch/isbnInquiry.asp?btob=Y&endeca=1&isbn=027597510X&itm=73)Comments in a chat room
Tue Feb 15 2005, referring to this webpage (from http://www.funtrivia.com/ubbthreads/showflat.php?Cat=0&Number=404203&an=0&page=0)What I found interesting to ponder was the fact that the world's poorest countries were also the ones with the lowest IQ average, generally speaking. Does the fact that they have been poor for generations mean that their IQ average is low because they are poor or are they poor because they have a low IQ average? I found the figures to be presented in a non-racist manner myself, though if I have missed something please advise. The site itself is fascinating.
Given that most of the lower ones are African nations I wonder if poor nutrition through drought after drought would affect IQ overall. I guess that would come under your "been poor for generations mean that their IQ average is low" theory.
Factors other than IQ in economic success
Research shows that
IQ accounts for only 1/3 or less of a person's income - within a country. Other big factors in income are a person's social skills and ambition, together sometimes called Emotional Intelligence.While social skills have a major impact on a person's income within a country, they have little effect on national income. The reason? Research indicates that average
social skills (SQ) scores show almost no differences among racial groups. Ambition may have a similar worldwide pattern. As a result. IQ becomes the main cause for national wealth differences. Click for more information on how IQ, social skills and ambition relate to national wealth.Sloan replies to a question on low African IQ's:
Ken, you and many others have commented on national IQ findings. Your "quite interesting" phrase is much more subdued than what most people write.
First let me refer you to my main Nation IQ webpage: www.sq.4mg.com/NationIQ.htm (this page). On it, you will find links to its academic source: the book Intelligence and the Wealth and Poverty of Nations and the bio of its leading author Richard Lynn. I believe that book's data is well researched and is as accurate as we now know.
Yes, I agree with you that the old IQ term "moron" is unfortunate. It has taken on additional meanings and probably should be replaced. The IQ system relates to abilities to perform, compared to others, in an academic setting - such as high school. Most students in the under 70 IQ level do not graduate from regular high schools; they usually drop out well before graduation.
On the other hand, my research in Social Skills, particularly in SQ (Social Quotient), shows that low IQ students show a normal range of SQ scores. In other words, they are able to perform in social situations relatively normally. They are not social morons. It seems to me that most people wrongly lump academic morons and social morons as being in the same group.
I find it sad that many people in the world, particularly in Africa, have low IQ scores. Their futures are limited. But the fact that many of these individuals have average to outstanding social skills means that they could contribute to society in many ways other than in using academic type skills.
Responses to Sloan's comments above, particularly the last paragraph:
1. from Ken: "Many thanks for a helpful reply. Cognitive functioning is mediated by language, of course."
2. from Richard Lynn: "Good reply. (You say) Many (ways)? What about the high crime rates of blacks in many countries?"
============================
more on
IQ and the Wealth of Nations (from: http://www.lagriffedulion.f2s.com/sft.htm)Graphs of IQ and Economic Success
The relationship between IQ and individual achievement is well known. No where is it better documented than in Herrnstein and Murray's The Bell Curve (Free Press, 1994).
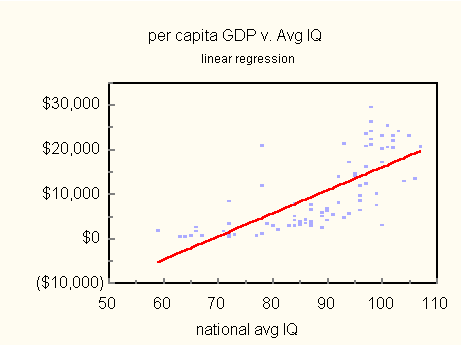
Lynn and Vanhanen have scaled this connection up to a national level. They expose a relationship between national wealth and IQ. You can see the relationship best in a graph (Figure 1).
Figure 1. Per capita GDP vs. national average IQ. The regression line is shown in red.. Notice how GDP is positively correlated to average IQ. The correlation coefficient is 0.733, IQ explaining 54 percent of the GDP variance. Values this large are rare in social science. In the social sciences, correlations of 0.2 are said to be "low," 0.4 are "moderate," and 0.6 are "high." So 0.73 is most impressive.
A correlation coefficient (correlation for short) is a quantity that reflects the strength of association between two variables. Its values range from -1 to 1. If variables are independent of one another, their correlation is zero. If they are perfectly correlated their correlation is 1 or -1. Positive coefficients mean that one variable gets larger when the other gets larger, and negative correlation the opposite. The fraction of the variance explained by the independent variable is simply the square of the correlation coefficient. The regression line is the line that best fits the data.
For a list of all countries ranked by income per person in 2002, see http://www.worldfactsandfigures.com/gdp_country_desc.php
Explanation for some outlying points on the above graph:
South Africa is the world's largest producer of platinum, gold, chromium and diamonds. None of this has much to do with human resources. Barbados and Qatar have also been favored with wealth-producing assets. Barbadian economy is based mostly on tourism. Exceptional year-round climate combined with proximity to the US strengthens its economic base irrespective of IQ. Similarly, oil revenue accounts for Qatar's extraordinary GDP. Finally, with a market economy being necessary for prosperity, we find Communist China, with a mean IQ of 100, producing more like a country with a mean of 83. When the four outliers are removed, the correlation grows from 0.73 to 0.79. In this case, 62 percent of the remaining GDP variance is now explained by IQ.
Racial/ Ethnic Differences graphed:
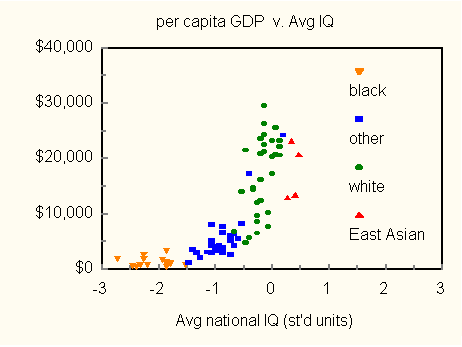
In Figure 2 below, the data is divided into contributions from four groups: blacks, (European) whites, East Asians and "others," The "others" include Asian Indians, Latin Americans, Pacific Islanders, Middle Easterners, other Asians, etc. Many of these countries have racially or ethnically heterogeneous populations. The outliers (South Africa, Barbados, Qatar and China) are not included in the graph:

Figure 2. Per capita GDP by racial group. "White" here means European white; "East Asian" means the racially homogenous polities: Taiwan, South Korea, Hong Kong, and Japan. IQs cluster by race.
East Asian points are off the graph's trend line
Taiwan, Japan, South Korea and Hong Kong, all with homogeneous populations, have the highest IQs reported here. We might therefore expect them to be among the wealthiest of nations. Their numbers, especially those of Taiwan and South Korea, however, tell another story. With average IQs of 104 and 106, respectively, per capita GDPs of about $13,000 seem much too low for Taiwan and South Korea.
Country average IQ and per person GDP ($13.000 for Taiwan)
Taiwan 104 13,000
South Korea 106 13,478
Hong Kong 107 20,763
Japan 105 23,257
The observations raise questions about East Asian achievement. IQ alone does not determine wealth. Perhaps East Asians are wanting in other attributes. Or, maybe there are aspects of Eastern culture that undercut creativity. These questions need to be investigated.
Go to:
Causes of IQ differences among races and nationsGo to:
low IQ is one cause of African povertyGo to:
Success of Nations - causes besides IQGo to:
Home pageThe ads below are placed by Google.com - they are not necessarily endorsed by this site
>